Linking Geological to Petrophysical Attributes: To Lump or Not to Lump
April 28, 2020 | 5 Minutes Read
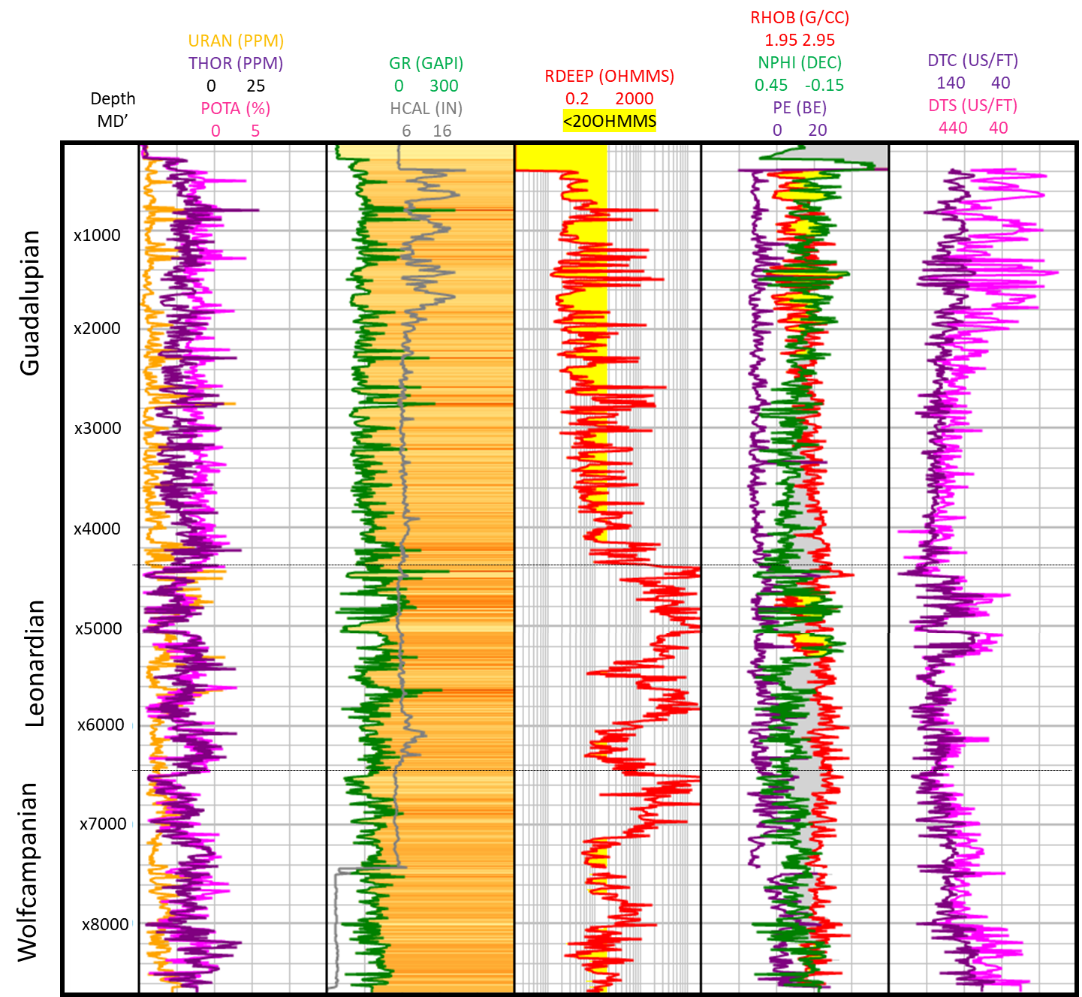
The Delaware Basin of the greater Permian system in West Texas is a complex setting with varying stratigraphic patterns. The key to the Delaware Basin is understanding deep resistivity and sonic log responses, as it presents a simple way to differentiate the stratigraphy by scaling and color-shading acquired open hole data. Through wireline associations and interpretation such as applied cutoffs on deep resistivity and sonic, a scientist can identify key aspects of the stratigraphic stack such as the Delaware Mountain Group conventional sands, the top Avalon shale, unconventional tight sequences of the Leonardian (Bone Spring), Wolfcampanian (Wolfcamp), Pennsylvanian, Barnett, Woodford and Ellenburger formations. These rock types are challenging to decipher from raw open hole wireline signatures if the context of the wireline responses is not interpreted. However, by identifying and using open hole wireline associations in the geological context to interpret what the variances in petrophysical characteristics mean, differentiation of these play types is possible. Based on the open hole wireline characteristics in geological and petrophysical contexts, a scientist can then unlock the unconventional potential and assess poor versus increasing reservoir quality. (Figure 1)
A key example of this is the ability to delineate the Bone Spring sandstone intervals (low stand systems tract) from the Bone Spring carbonate intervals (highstand systems tract). Identifying and differentiating (i.e., not lumping) geologic maps linked to petrophysical attributes highlights key differences in the hydrocarbon elements and overall unconventional quality of the subsurface. If scientists lump these intervals together and generate map-based attribute comparisons, the statistics of those properties become muted and basically meaningless. Take, for example, an average deep resistivity over the Bone Spring (see Figure 2). If lumped, we are left asking ourselves what exactly does that average number represent or mean? Alternatively, if we break up the stratigraphy and take an average specifically over the sandstones instead of just over the ‘carbonate’ intervals, our mean statistics gain more accurate representation (see Figure 3). We see, where we were lumping across the stratigraphy, that one population of values should really be represented by two distinct populations. Now, we better constrain the variation in these mean attributes (as an example). We can then also apply cutoff logic to expedite the ‘zoning’ over given depth ranges, requiring less intensive tops-picking for exploration-scale assessment efforts.
In the Permian system, there are endless combinations of log attributes that can be used to differentiate and assess the stratigraphic stack. Focusing on two key attributes can represent the majority of the changing trends across the Delaware and Midland basins. While this example is focused on the Delaware Basin, using raw log cutoffs should always be considered in quick-look efforts to reduce timelines when fit for purpose to answer specific questions.
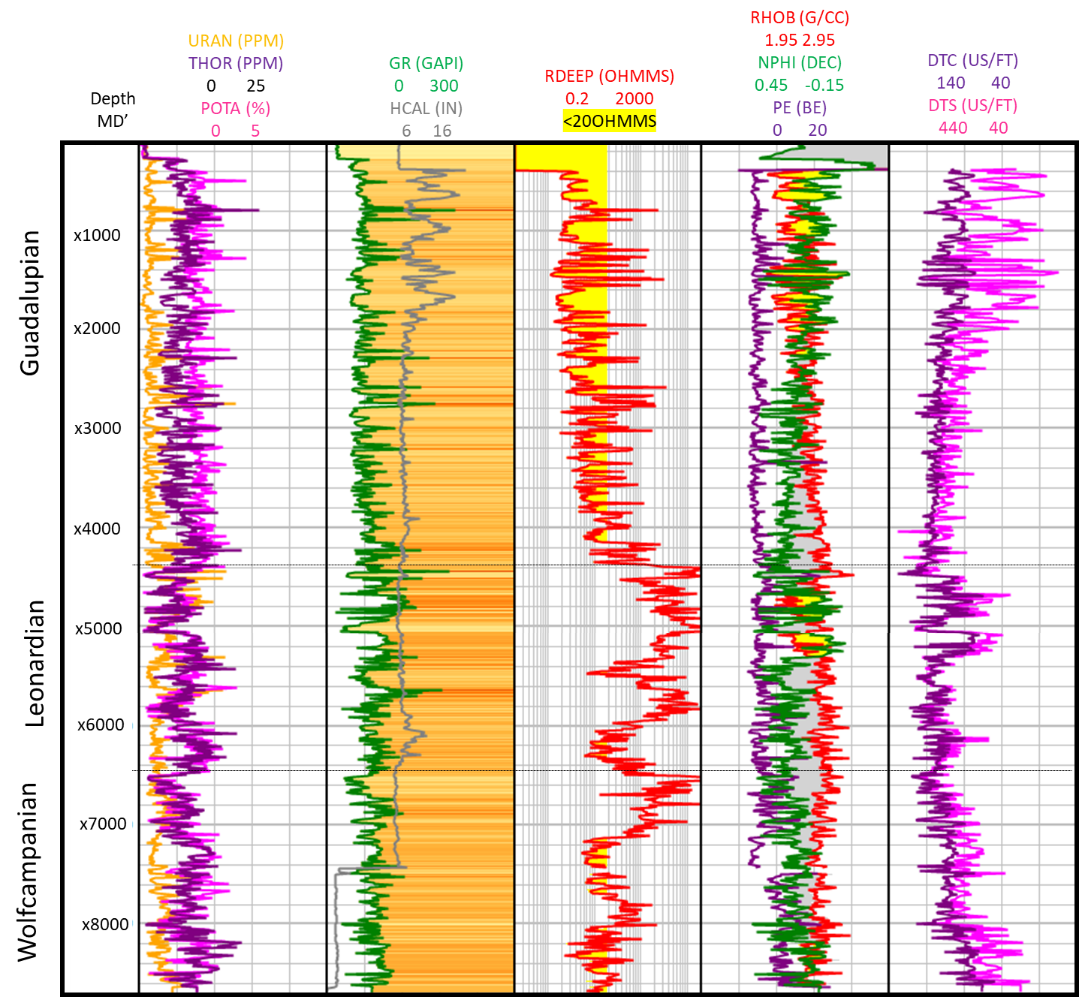
Figure 1. Based on the open hole wireline characteristics in geological and petrophysical contexts, a scientist can then unlock the unconventional potential and represent quick-look mapping attributes that highlight variation in a given stratigraphic interval.
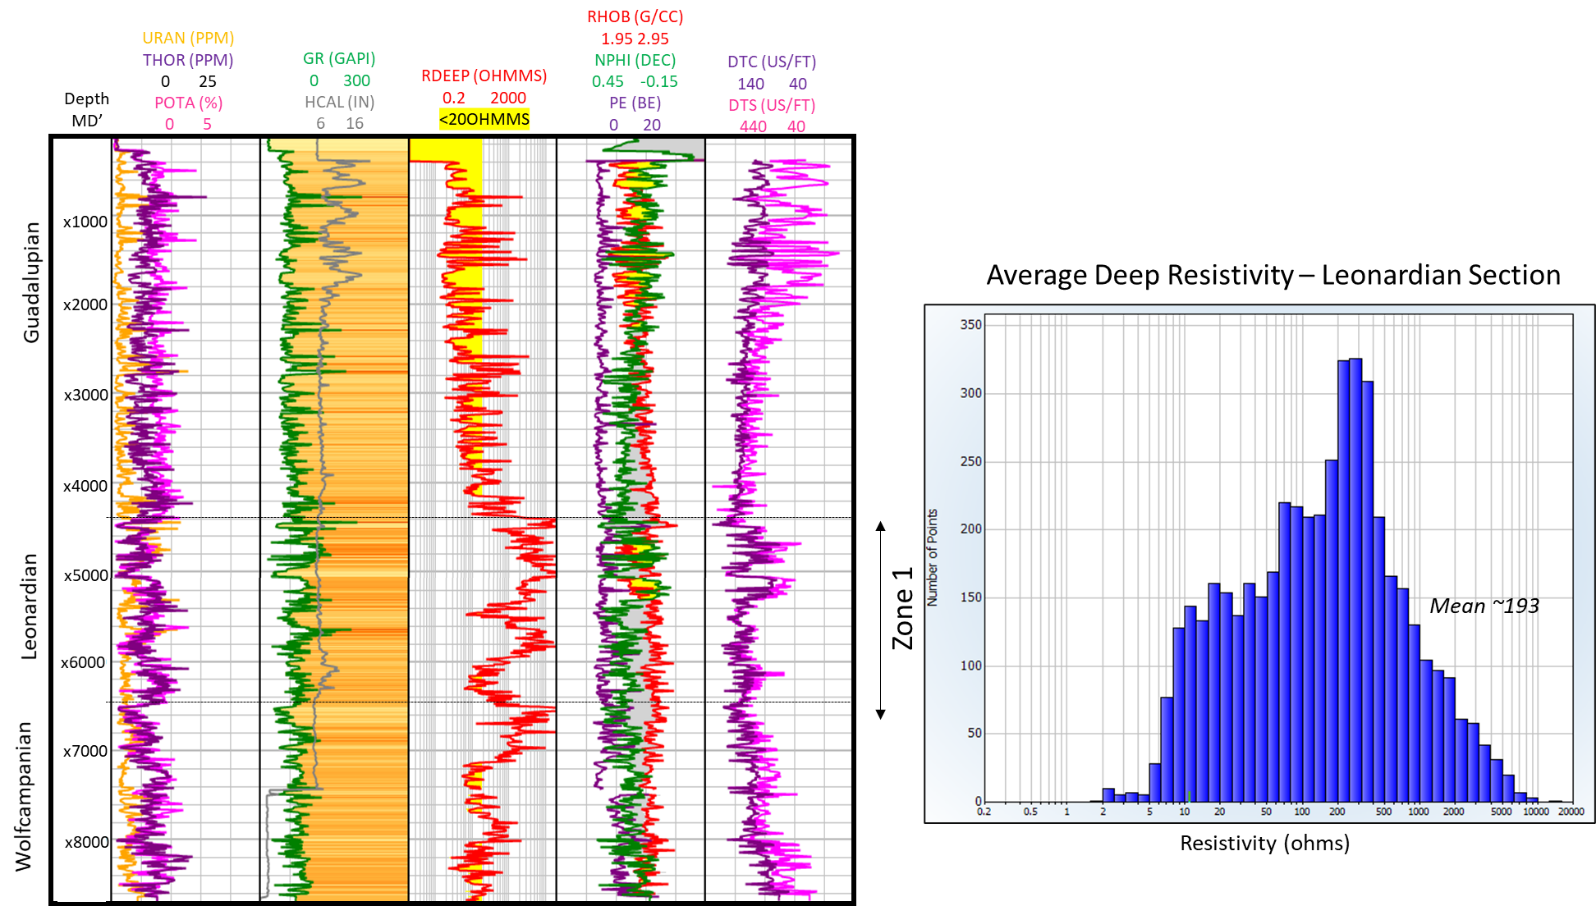
Figure 2. Example of lumping across the Leonardian section. Resulting deep resistivity average is ~193 ohmms.
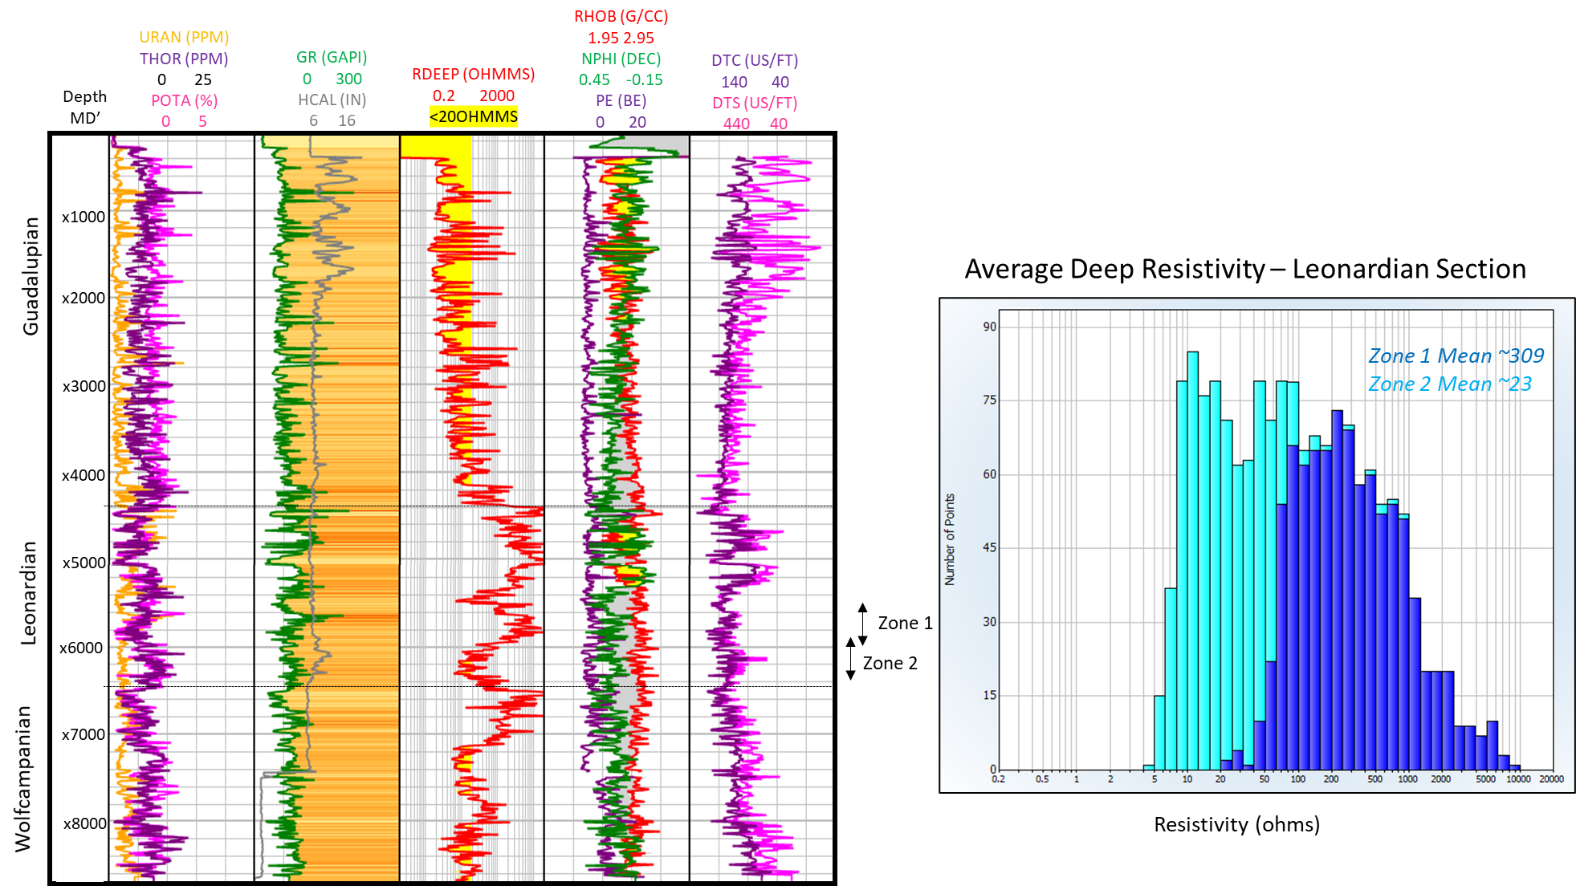
Figure 3. Breaking the Leonardian section into a minimum of two zones results show how the zone means and populations now change and are representative of the attributes. Splitting into a minimum number of vertical intervals enhances the ability to represent variation/change. These small changes to the lumping versus splitting discussion can be tested on all investigation scales.